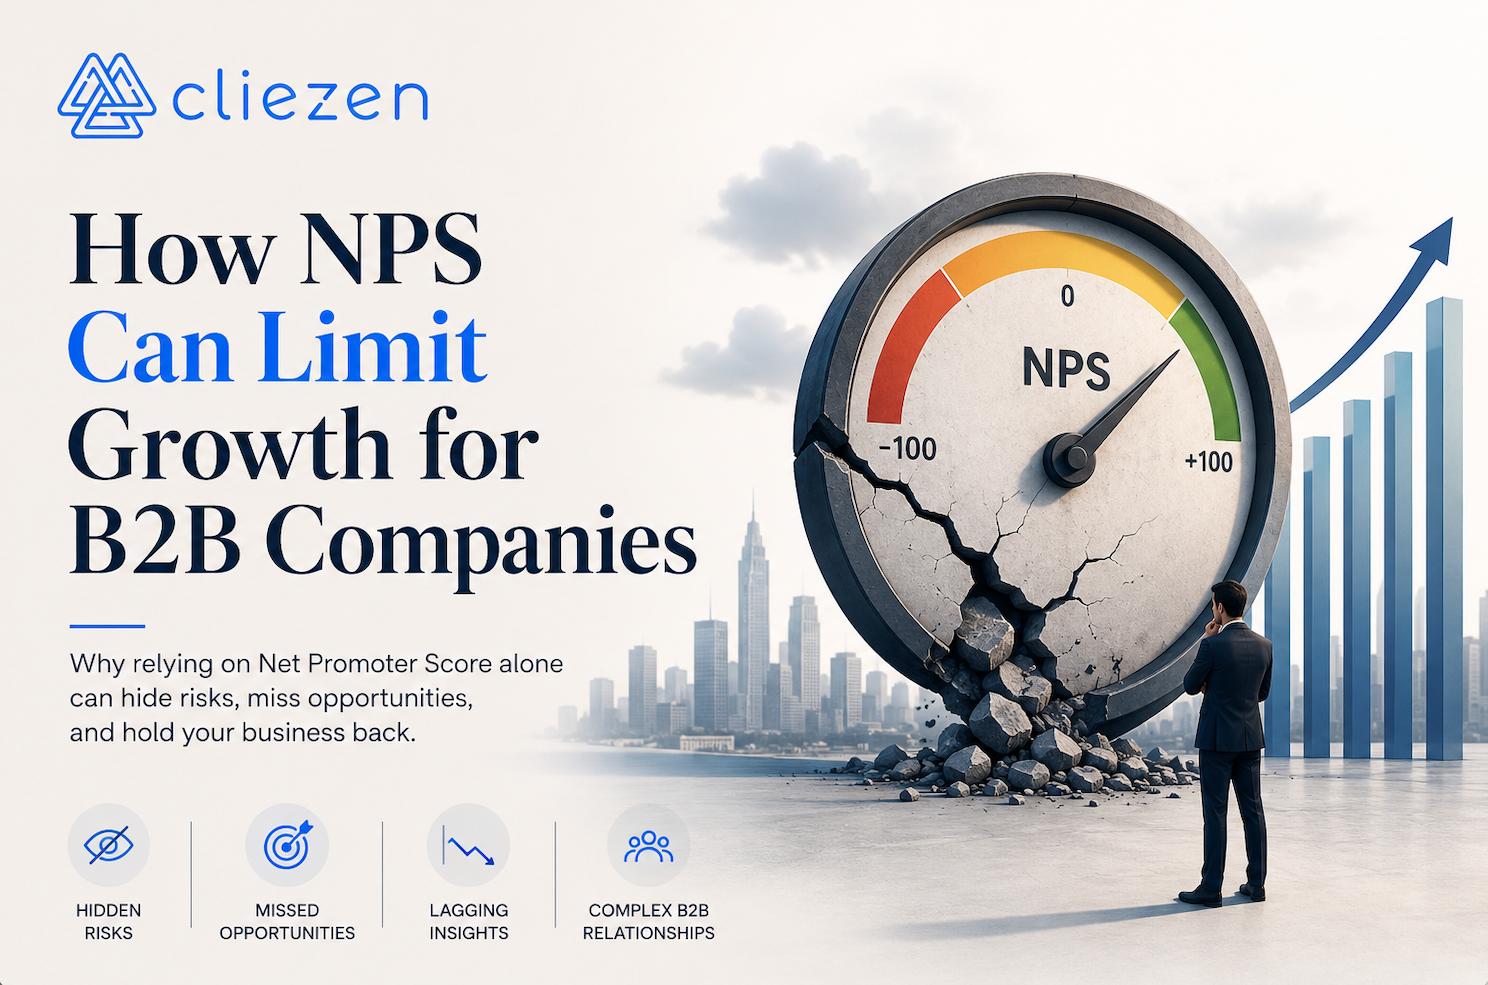
NPS for B2B: How to Measure It and Where It Falls Short
NPS for B2B: How to Measure It and Where It Falls Short
Net Promoter Score is easy to understand, easy to report, and widely recognised by executives. That explains much of its popularity. In B2B, however, the hard part is rarely calculating the score. The hard part is deciding whose answer represents the account, what the score actually tells you, and what to do when a relationship involves several stakeholders with different priorities.
This guide explains how NPS works in B2B, how to run it properly, what a good response rate looks like, and where teams should be careful about treating one score as a complete view of client health.
What is NPS in B2B?
NPS asks a single question: how likely is the respondent to recommend the company, product, or service on a scale from 0 to 10?
- Promoters: 9-10
- Passives: 7-8
- Detractors: 0-6
The score is calculated by subtracting the percentage of detractors from the percentage of promoters. The result ranges from -100 to +100.
The arithmetic is the same in B2B and B2C. The interpretation is not.
Why NPS is harder in B2B
A consumer relationship often has one buyer and one primary user. A B2B account can include an executive sponsor, procurement, finance, operations, daily users, technical stakeholders, and an account owner on the supplier side. Those people can have very different experiences of the same relationship.
A daily user may give you a 10 because support is responsive while the executive sponsor is unhappy with strategic value. Procurement may be satisfied with commercial terms while operations is frustrated with delivery reliability. A single account-level NPS number can hide those differences.
This creates three recurring problems:
- Representation: one respondent rarely represents the whole account.
- Diagnosis: the score tells you sentiment, but not the root cause.
- Timing: a score can look healthy while expectations have already started to drift.
Who should you survey for B2B NPS?
Start with the people who materially influence renewal, expansion, adoption, and day-to-day success. That usually means more than the most active user.
For an important account, consider including:
- the executive sponsor or budget owner
- the primary operational contact
- key users or service recipients
- procurement or commercial stakeholders where relevant
- technical or implementation stakeholders where relevant
The goal is not to maximise the number of responses. It is to avoid mistaking one person's experience for the health of the entire relationship.
How often should B2B companies run NPS?
There is no universal cadence. For long-term B2B relationships, a quarterly or semi-annual NPS programme is common. The more useful rule is to avoid surveying on a calendar without considering what has happened in the relationship.
Major onboarding milestones, service changes, delivery issues, renewal periods, and executive reviews can all change how a client experiences the relationship. A fixed survey schedule can miss those moments.
If you use NPS, combine a regular cadence with event-driven feedback and ongoing account signals rather than treating the NPS survey as the only source of truth.
What is a good B2B NPS response rate?
Response rate matters because low participation increases the risk that the score reflects the most engaged or most frustrated contacts rather than the account base as a whole.
There is no single benchmark that applies across industries. In practice, B2B response rates vary heavily based on relationship strength, survey frequency, sender, audience quality, and whether the request feels relevant to the recipient.
A useful internal benchmark is more valuable than a generic market number. Track response rate by account segment, role, industry, and survey cycle. If participation is falling, treat that as a signal in itself.
For a deeper look at this topic, see our article on NPS alternatives for B2B.
What does a good B2B NPS score look like?
Be cautious with generic claims that a particular score is universally good or world-class. NPS benchmarks can vary by industry, geography, survey method, respondent mix, and even how the question is phrased.
The more useful comparison is against your own historical performance and against business outcomes. Look at whether higher or lower scores correlate with renewal, expansion, support burden, engagement, and executive sponsorship in your own customer base.
If the score does not help you predict or improve those outcomes, the benchmark itself has limited value.
The biggest limitation of NPS for B2B: it is weak at diagnosis
An NPS score can tell you that a respondent is unhappy. It does not tell you whether the problem is responsiveness, product fit, delivery reliability, communication, strategic alignment, reporting, onboarding, or something else.
That distinction matters because B2B teams need to know where to intervene. A customer success manager cannot act on "NPS is 18". They can act on "the executive sponsor feels the team is too reactive and sees no strategic input before renewal".
This is where teams often add follow-up questions, open text, interviews, health scores, product usage data, CRM activity, or account reviews. Those additions are useful, but they also reveal the core limitation: the single NPS number is not enough to manage a complex relationship.
NPS can also miss expectation drift
B2B relationships change over time. A client that originally valued responsiveness may later care more about strategic guidance, reporting, integration, cost control, or delivery consistency.
If the supplier keeps measuring the same generic loyalty question, it may miss that change until dissatisfaction becomes visible in renewal behaviour or escalation.
Cliezen focuses on this gap between what the client expects and what they actually experience. It gathers feedback across relevant contacts, identifies what matters most to different roles, and turns negative movement into specific actions for account and customer success teams.
When NPS is still useful
NPS can still be useful as a simple directional metric when everyone understands what it can and cannot do. It works best when:
- you use it consistently
- you know exactly who is responding
- you segment the results by role and account type
- you connect the score to qualitative feedback
- you do not treat it as a complete customer health model
The mistake is not collecting NPS. The mistake is assuming the score explains the relationship.
Better measurement for complex B2B relationships
For high-value B2B accounts, the strongest approach usually combines several layers of evidence: direct feedback from multiple stakeholders, behavioural and commercial data, relationship-specific expectations, and a clear process for closing the loop.
That gives teams something more useful than a number to report. It tells them where risk is building, which part of the relationship needs attention, and what action is most likely to improve the outcome.
If you are evaluating alternatives, read NPS Alternatives for B2B: What to Use Instead.
Summary
NPS for B2B is simple to calculate but difficult to interpret well. Multiple stakeholders, long relationship cycles, changing expectations, and complex service delivery mean one score rarely tells the whole story.
Use NPS as one signal if it helps your organisation, but connect it to the people, expectations, and business outcomes that actually determine whether the relationship stays healthy.